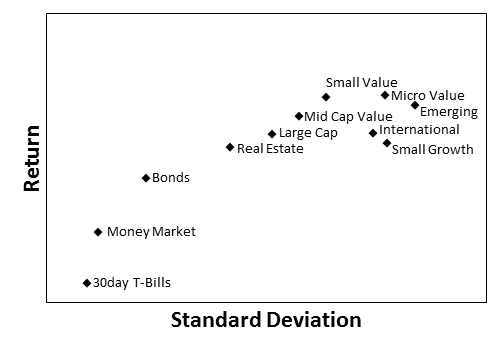
The capital asset pricing model (CAPM) approximates return as a linear function of beta. Beta is a measurement of how much an investment fluctuates in sync with the markets. For a stable bond, beta might be zero. The markets as a whole have a beta of 1.0. Volatile technology stocks might have an even higher beta.
The efficient frontier measures all investments on a scale of risk and return. Risk is commonly placed on the x-axis, and return is placed on the y-axis. Risk is the volatility of an investment as measured by standard deviation. And return is the average return over the same time period. This is similar to the CAPM, but with standard deviation standing in for beta.
The risk and return components of the efficient frontier are computed for a specific time period, usually one year. These are the volatility and return measurements with which investors are most familiar. Investments with a high standard deviation over one year have a lower standard deviation when measured over longer periods. Shorter time periods produce higher measurements of volatility.
Consider the year starting in October 2008. The S&P 500 went from 1,166.36 to 1,057.08, down 9%. For the year, losing 9% seems like a relatively reasonable loss. But the roller-coaster ride bottomed out at 682.55 before recovering. Had you asked investors if they were willing to lose 42% and then from that point gain 55% (as measured from the new low), they might have balked at the volatility.
This is why time horizon matters. There is a reversion to the mean return, but it requires a long enough investment period to revert. Volatility in the long term is much less of an issue than it is in the short term.
The efficient frontier is composed of investments with the highest return and the lowest volatility. The most efficient investments are those such that no other investment has a higher return for the same amount of standard deviation. Or there is no investment with a lower standard deviation for the same expected return.
Many investments fail the most basic criteria even when considering their efficiency. It takes decades of data to determine a strategy’s expected return and eliminate random luck. Loyalty to any track record less than half a century should be held lightly. For example, there will always be mutual fund advisors with incredible 10-year track records. Statistically, this is the inevitable result of random chance. It doesn’t matter that such a fund manager has a system any more than if thousands of penny flippers had systems. Statistics would still produce a lucky penny.
Investments must be publicly priced and traded to measure volatility accurately. Private equity investments may appear stable, but that is only because you aren’t trying to sell them every day and seeing how little or how much you can get for it. Hidden volatility is still volatility.
Any investment that doesn’t trend upward is not an investment. It has a zero or negative expected return. These are not investments. They are speculations. All futures or options are bets against the party on the other side of the contract. Such speculations are zero-sum exchanges. And because they have zero expected return, they are inferior to the rate of risk-free return. Therefore, they are not on the efficient frontier.
Finally, many investments are so laden with fees and expenses as to diminish their returns without dampening their volatility. The efficiency of these can be measured, but it will be found wanting. Such investments fall in the lower right quadrant of high volatility and low return. The correct allocation to inefficient investments is zero percent. Diversification does not mean to invest in inefficient investments. Your goal should be to invest somewhere along the efficient frontier.
The efficient frontier is a continuum of portfolios made up of investments along the upper left edge. Each point on this line represents a potential portfolio that can be built from allocations of the most efficient assets. Most efficient in this case means getting the best possible return for a given amount of volatility.
The efficient frontier is a mathematical construction that can be computed given any finite set of investment options. Only two pieces of information are needed for each investment: average return and standard deviation. These position the investment on the graph and determine if it will be part of the efficient frontier.
The efficient frontier generally tracks the straight line of CAPM, except that it is a curve and asymptotically reaches a point of diminishing returns. Beyond this point additional volatility does not provide any significant additional average return. This limit is generally set by the best performing asset that exists beyond which additional risk can’t get a better average return.
Among stocks in the United States, microcap value stocks might have the highest average returns but also the highest volatility. Next might be small-cap value and then mid-cap value. On the low end of volatility would be the aggregate bond index and 30-day Treasury bills.

The efficient frontier is approximated by connecting the dots of all the most efficient investments, but different mixes of investments can produce even more efficient portfolios. To add to this blending effect, one more piece of information is needed: the correlation between each pair of investment options. Next week we will look at how a blended portfolio of asset allocation produces even higher returns.