
There are a number of investment blogs with articles describing what return it will take to earn your money back from an investment loss. I am purposefully not going to link to any of them. They usually use emotionally charged words to describe how difficult it is to recoup your losses from terrible market declines in order to manipulate the reader with fear to take whatever action the author recommends.
They describe what rate of future returns is required to break even. For example, if you experience a 50% loss in value, it will require more than a 50% gain in value in order to break even – it will require a 100% gain. Imagine you purchase an investment for $100 and the price drops to $50. Starting from $50, you have to double your money (a 100% gain in value) in order to get back to $100.
Sometimes they will accompany their dire warnings with a table like this:
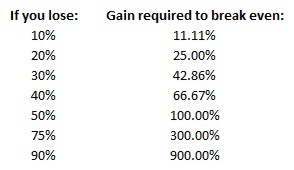
Their math and conclusions are wrong for at least five reasons.
1. The stock market normally gains more than it loses.
The most an investment can lose is 100%, but an investment can appreciate many hundreds of percent. The S&P 500 closed June 30, 2016 at 2,098.86 up 736.73% from its value 30 years earlier on June 30, 1986.
When your $100 investment appreciates to $110, it is said to have gone up 10%. When it drops back down to $100, it is said to have only lost 9.09%. Or when it rises from $100 to $150 it goes up 50%, but if it drops back to $100 it only drops 33.33%.
None of this is anything worrisome or sinister about stock market losses, it is simply a matter of calculating the percent of change relative to the original value. They want you to believe that it would be hard to regain 100% after dropping 50%, but this actually happens all the time.
2. Returns are computed by compounding, never by adding
You cannot simply add -50%, -50%, and +200% to get cumulative change as these deceptive posts want you to believe. If an investment goes down by 50% and then again by another 50%, it has not lost 100% of its value, only 75%. Change is cumulative over time.
A “time-weighted return” is the proper way to account for investment performance. As Krisan Marotta writes on her website: A time-weighted return “links together a series of returns on smaller sub-periods or ‘intervals’ through a geometric formula.” If an investment drops from $100 to $25, it is down 75%. If it appreciates back to $100, it will have appreciated 200% from the bottom, but the overall cumulative change is zero percent because it ended at the same place it started.
The entire way these deceptive posts ask you to think about performance is inaccurate. Take these examples. If you add the percent change over all five months, they add up to -50%, but their true cumulative returns are all different:

When a cumulative time-weighted return spans more than a year, special math is required to compute the annualized return. Consider this sequence of five years of 12% annualized returns:
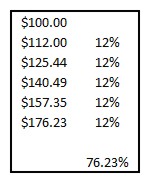
The cumulative 5-year return is 76.23%. Many investors mistakenly take this number and divide by five years in order to estimate that they have received a 15.25% annualized return. Computing an annualized return this way grossly over estimates your annualized return. Investors who do not carefully understand the math behind annualizing compounded returns will boast about fantastic returns. In this example, we can obviously see that we only received a 12% compounded return. The simple math of division is incorrect.
The formula for computing an annualized time weighted return is:
(( the final value / the original value) ^ ( 1 / the number of years )) – 1
In our example, we take $176.23 / $100 and get 1.7623. Then we raise that number to the 1/5th power. This is equivalent to finding the 5th root of 1.7623, which in turn is asking the question, what, when multiplied by itself five times, would be equal to 1.7623. Computer spreadsheets or financial calculators have functions to raise a number to a fractional power. The answer in this case is 1.12. You can check that value by computing 1.12 x 1.12 x 1.12 x 1.12 x 1.12, which equals 1.7623416832. After finding that 1.12 is the 5th root, we subtract 1 and get 0.12 for a 12% annualized return.
Returns are never added together and therefore -50% and +50% would never cancel each other out. They ask you to think that if it’s easy to lose -50%, it must be harder to gain 100% back, but that requires misleading readers about the fundamental mathematics used in calculating returns.
3. The stock market cannot go to zero.
Most of the articles warning about the difficulty of recouping losses are filled with the emotional message that you don’t want to invest very much in the stock market because you might lose it. And while they don’t explicitly say so, the emotional message is that once lost, invested money is very difficult to gain back. They exploit the fact that our brains are wired to emotionally feel the pain of loss more than the happiness of gain.
While stock market losses of 50% are possible, the lessons to be learned from them do not include avoiding the markets. While an individual stock can go to zero, any index worth investing in cannot go to zero.
If the price of an index were to begin to approach zero, I would be able to take the change out of my pocket and purchase ownership of every company in the index. Long before that, people with a lot more money than I have would have purchased every company in the Index. Stock prices simply represent the cost at which people are willing to buy a portion of ownership of a company. Somebody will almost always be willing to buy a company for a low price, which will signal interest in the company, which will drive the stock price (and its value) back up.
The point where investors with cash are willing to stop a market decline by buying stocks at lower prices is called “resistance.” Once you know how markets are made, you realize that markets can drop just because some very light trading day in the summer only had people who were willing to sell that day. Market volatility is normal and it can drop sharply, but the market as a whole cannot go to zero. And neither can major indexes such as small cap, technology, or Hong Kong.
It is better to stay in the markets during a drop and experience the recovery than to drop out due to fear.
4. Their warnings do not suggest alternative options.
Most dire warnings about the stock market are intended to trouble the average investor as a sales technique. You won’t consider their financial product until you are first dissatisfied with your own investments. Fear and worry are, unfortunately, still the best sales technique.
It is an option to invest less money in the stock market, but whatever money you put in the stock market will still be subject to market fluctuations. Investment choices that shelter you from market volatility may actually be illiquid, laden with fees, filled with financial hooks, trend sideways, or just be too good to be true. Any of these are worse than being traditionally invested. The markets may be inherently volatile, but they are also inherently profitable.
5. Their math is wrong if you rebalance regularly.
The math they use to scare readers suggests that in order to recover from a 50% loss, you will have to have a 100% gain. This is based on the idea that if your $100 investment drops to $50, you will have to double your money just to break even. But this ignore the effects of rebalancing.
After one sector of your portfolio goes down 50%, the principle of rebalancing would suggest you buy more of that sector and sell some other sector which has appreciated. The rebalancing bonus is proportional to high volatility and low correlation between sectors. A loss of 50% is very volatile and should provide a valuable rebalancing opportunity. Once you have understood the science behind the rebalancing bonus, you realize that volatility is an opportunity for your asset allocation to reap better returns. Here is our example including changes for rebalancing:
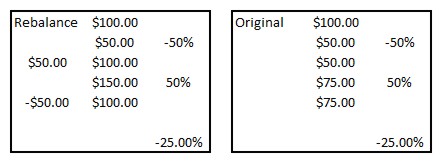
The rebalancing example illustrates that if you rebalance and add $50 after a 50% loss, then you only need to experience a 50% gain in order to break even.
Just to be clear, we only recommend rebalancing like this for sectors worth investing in. You would not want to rebalance into an individual stock which might go bankrupt nor would you want to rebalance into a sector of the economy which might disappear.
In our example, rebalancing reaps an additional $25 and therefore breaks even when the stock has not recovered its full value and is still down -25%. Rebalancing has the greatest gains when the markets are the most volatile.
As an aside, if you measure the time-weighted return of the sector in either example above, the time-weighted return will be -25% even though in the first example you have broken even. A time-weighted return measures the return of whatever money you have given to this advisor or this strategy. It is the simulated return of a fixed amount of money in this strategy and eliminates the effects of cash flow into or out of the strategy. Sometimes a time-weighted return can be positive and the dollar gain negative or vice versa on account of cash flows into or out of the investments being measured.
In our example above, while the gain from rebalancing may not show up in this sector, it would show up in the portfolio as a whole. The flows into this category probably came out of some other category during the rebalancing process. This may have boosted the returns of the portfolio by moving money from a sector which had performed well in the past into a sector which was about to perform well in the future. In this way, a portfolio’s time-weighted returns can be higher than simply the weighted average of the time-weighted returns of its components.
Many advisors and most investors don’t really understand the math on how to compute investment returns. As a result, there are a number of false claims of misleadingly high returns which are simply not true. Safeguard #2 from our Safeguarding Your Money Series is to walk away from “too good to be true.”
We try very hard to keep our website focused on the small changes which can have enormous affects over long periods of time. We want to encourage you to have a calm and reasoned approach to your finances which is not driven by emotions.
Photo used here under Flickr Creative Commons.
Latest posts from David John Marotta
- #TBT Learning to Live on Your Own - April 18, 2024
- #TBT Frequency Matters More Than Height - April 11, 2024
- Implement a Savings Waterfall for 2024 - April 9, 2024