
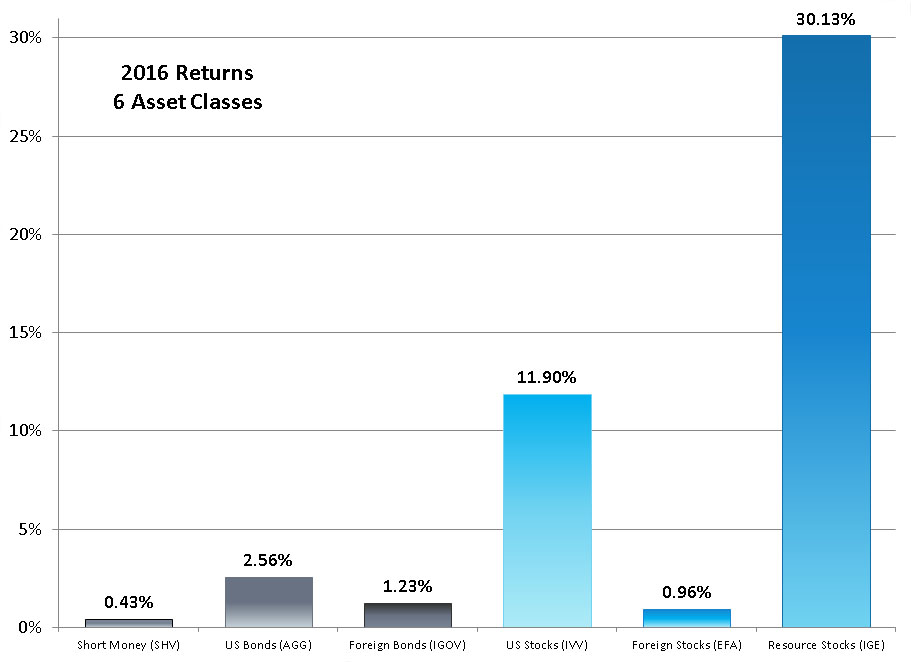
2016 was a good year for stocks in general with a number of noteworthy details. For context, see this graph of the returns for six iShares product which we use to roughly represent the six different asset classes.
 No one security is a perfect reflection of all the diverse holdings that fit within an asset class, but these six are good broad indicators of their asset classes. We’ve written five articles describing some of the most interesting factors in this year’s returns.
Resource Stocks was clearly the asset class with the best returns this year despite having been the worst asset class the year before. The index fund we use to represent resource stocks is mostly Energy with a little bit of Materials. Within Resource Stocks, Materials was the best category of the year, appreciating 54.44%.
Real Estate Investment Trusts (REITS) are not represented in the index fund used here (IGE) and while they had nice positive returns, they did not do as well as Energy and Materials.
We use iShares MSCI EAFE ETF (EFA) to represent Foreign Stocks. The MSCI EAFE Index had a return of only 1.00% with the iShares ETF based on that index just slightly below at 0.96%. When foreign developed countries are lumped together, the performance is usually less than desirable. As you can read in our “Freedom Investing and Emerging Markets in 2016” article, countries high in economic freedom once again did better than the foreign index as a whole. Developed countries with economic freedom deserve a place in your portfolio. The emerging markets also had stellar returns which helped pull up the foreign stock returns of portfolios which included them.
We use the iShares Core S&P 500 ETF (IVV) to represent the US Stock asset class, but you can read in our “US Stock Investing in 2016” article how tilting toward Small-Cap and Value boosted returns. Although the S&P 500 did very well this year, you can read next week’s article “To What Benchmark Should I Compare My 2016 Returns?” about why we don’t recommend using the S&P 500 as the benchmark against which you should compare your returns.
Finally, regarding Bond returns, although it looks from iShares Core U.S. Aggregate Bond ETF (AGG) and iShares Core U.S. Aggregate Bond ETF that US Bonds had better returns than Foreign Bonds. For those investments, foreign bond returns exceeded the US Bonds significantly and the inclusion of inflation-protected securities would also have boosted the US bond returns in 2016.
For more detailed information, read our whole 2016 in review series, coming out over the next few weeks.
Photo used here under Flickr Creative Commons.
More in this series:

Bond Investing In 2016
Bonds had positive returns for the year despite returns peaking at the end of July and falling for the rest of the year.

Resource Stock Investing in 2016
In 2016, Energy and Materials had some of the best returns of the year.

To What Benchmark Should I Compare My 2016 Returns?
Investors always want to compare the return of their portfolio against some benchmark index. We suggest not using the S&P 500 for that purpose.

Freedom Investing and Emerging Markets in 2016
In 2016, the average return of the best investment products of the Freedom Six outperformed the Vanguard FTSE Developed Markets ETF by 6.75%.

US Stock Investing in 2016
The S&P 500 had another good year, ending up 11.96%. The S&P 500, however, only represents half of the US Stock asset class, and Small- and Mid-Cap stocks performed even better.
Latest posts from David John Marotta
- #TBT What Are Normal Market Movements? - April 25, 2024
- #TBT Learning to Live on Your Own - April 18, 2024
- #TBT Frequency Matters More Than Height - April 11, 2024